

Leading the most impactful AI transformations
Trusted by 500+ businesses worldwide


Industries
We apply data and AI in contexts where industry detail really matters. By grounding our work in the realities of each sector, we help organisations build practical, scalable solutions that hold up in real operations.


Build something great together
We help organisations make data and AI work in practice. From defining strategy to building and deploying data and AI platforms, we support the full journey: embedding governance, change, and new ways of working so solutions scale beyond pilots.
About us0+
Countries clients served across
0+
Nationalities on our team
0+
Offices
Designing intelligence with CLEVER°FRANKE
We partner with our design studio, CLEVER°FRANKE, to turn complex data into clear, usable experiences. Through interface design, data visualisation, and interaction, we help organisations build trust in AI, support better decisions, and drive adoption at scale.

Case study
Showing the impact of wealth on the world beyond financial gain
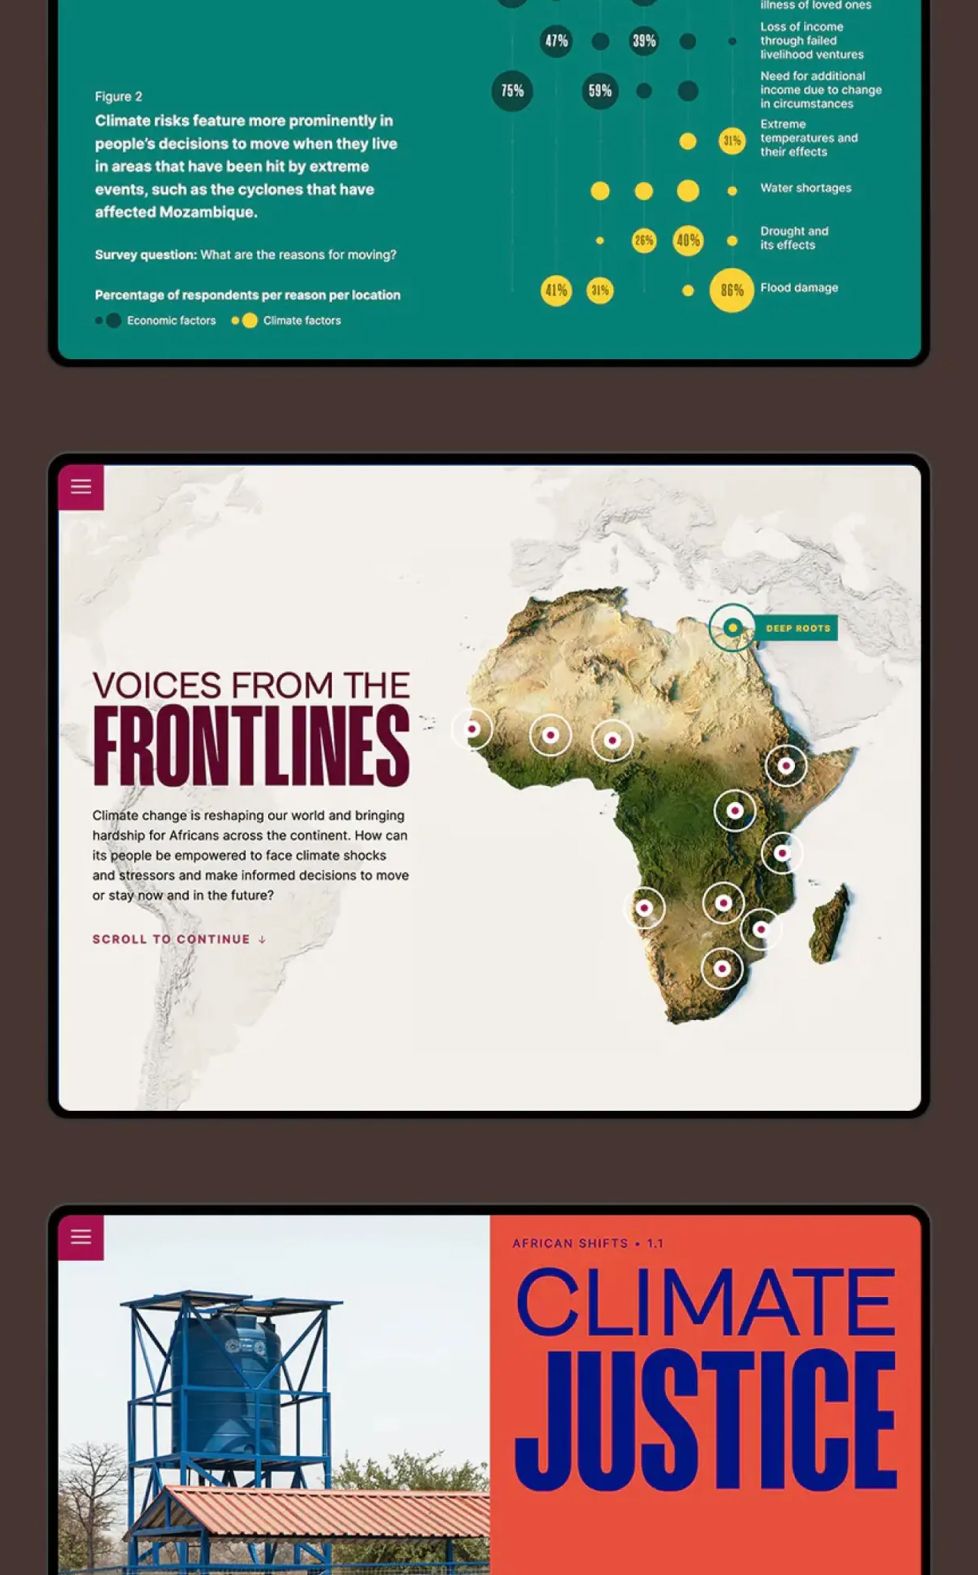
Case study
Raising awareness of climate-forced migration in Africa and the action needed
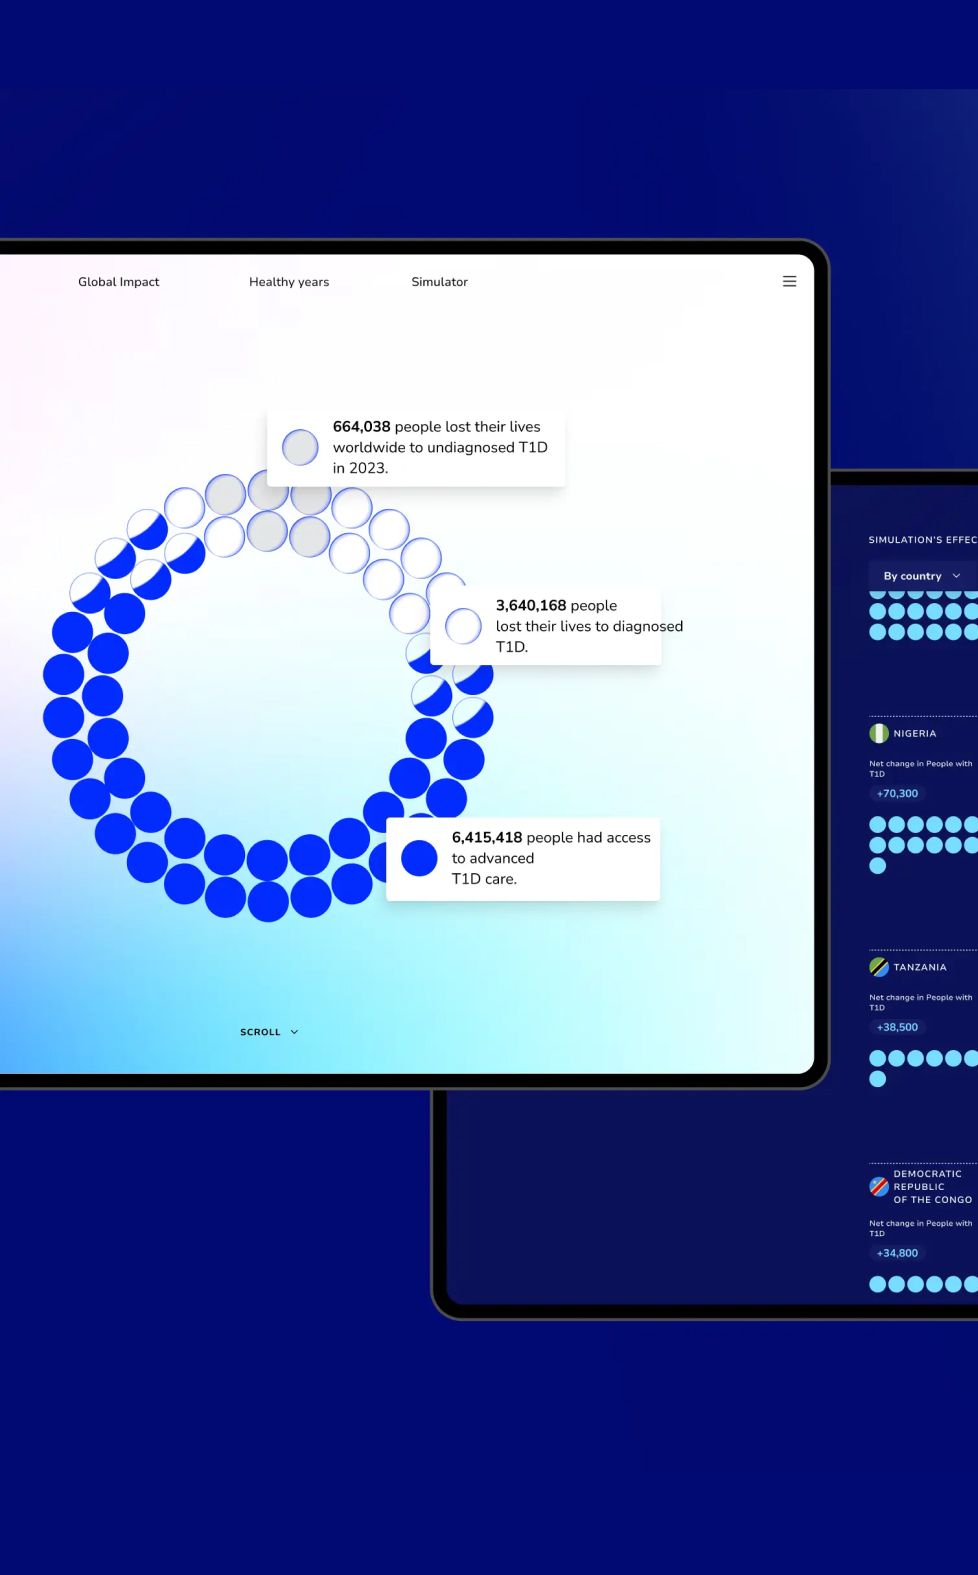
Case study
Driving change by showing the true impact of type 1 diabetes

Case study
Visualising pollen data as aata-driven bouquets
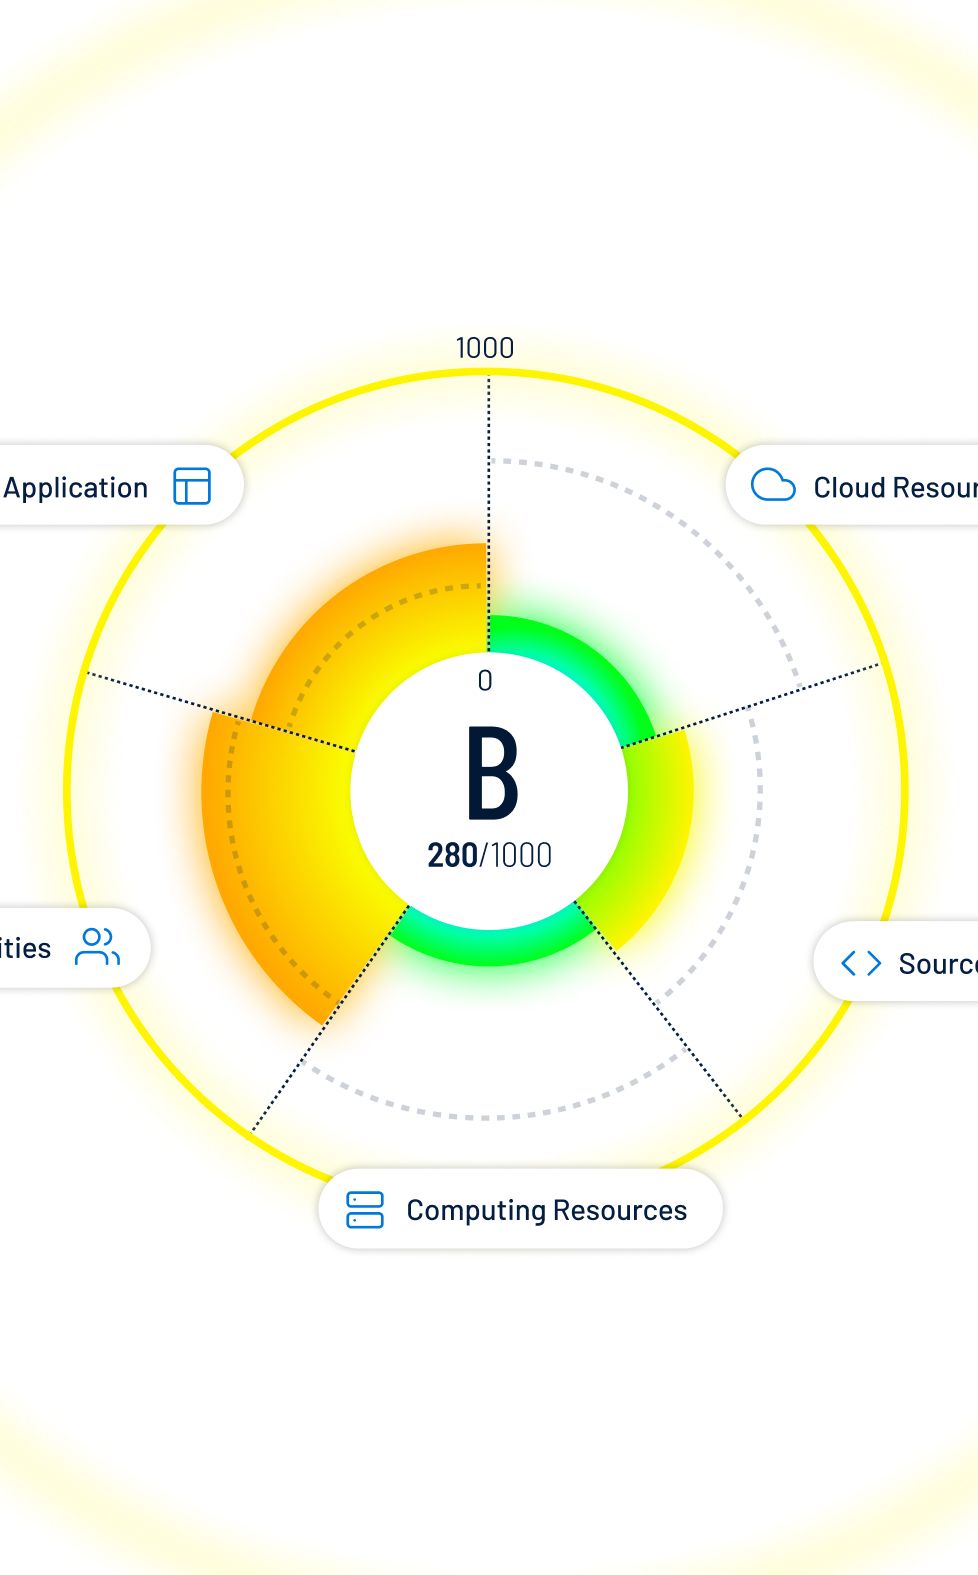
Case study
A single clear interface to manage the complex world of cybersecurity

Case study
A bold visual language that unites and celebrates
Featured cases
See how AI has transformed organisations like yours: the problems our clients faced, how we approached them, and what changed as a result.

Case study
Accelerating drug development time-to-market

Case study
Building a search engine for unstructured clinical trial data

Case study
Conducting an AI feasibility study for the Dutch government

Case study
How LATAM Airlines embraced business experimentation for revenue management

Case study
Investing in impact: Redefining Danish social welfare

Case study
Measuring the impact of non-profits: Why it matters and how data can help

Case study
Pricing transformation at Hunkemöller: Working with AI to deliver better markdown outcomes

Case study
Vinnova's data-driven impact on the life science industry


Life sciences
"They have proven their ability to transform our complex business requirements into a matching technical solution to solve our challenge with a very fast turn-around time, making the project efficient and allowing the experts to work focused on solving the real issues. "
Ibrahim Kamstrup-Akkaoui
Vice President at Novo Nordisk
Latest insights
Explore how AI is reshaping your industry and what we think about it to spark ideas for your own transformation.

Agentic code migration: turning lingering legacy to state-of-the-art software
Agentic code migration uses specialized AI coding agents and governed workflows to automatically analyze, convert, test, and refactor legacy code into standards‑compliant systems, making large‑scale platform and language upgrades faster, safer, and easier for development teams.

EoS pricing: why a solid pricing plan is not enough
End‑of‑Season pricing often looks solid on paper, but breaks down the moment real‑world variables start shifting. When teams can’t recalculate scenarios fast enough, strategy gives way to compromise, leading to margin loss and inconsistent execution.

Pricing Game: test your pricing strategy, without the consequences
Test your pricing strategy in a real-time AI simulation that lets you see the impact of your decisions—without any real‑world consequences.
Agentic code migration: turning lingering legacy to state-of-the-art software
Agentic code migration uses specialized AI coding agents and governed workflows to automatically analyze, convert, test, and refactor legacy code into standards‑compliant systems, making large‑scale platform and language upgrades faster, safer, and easier for development teams.
EoS pricing: why a solid pricing plan is not enough
End‑of‑Season pricing often looks solid on paper, but breaks down the moment real‑world variables start shifting. When teams can’t recalculate scenarios fast enough, strategy gives way to compromise, leading to margin loss and inconsistent execution.
Pricing Game: test your pricing strategy, without the consequences
Test your pricing strategy in a real-time AI simulation that lets you see the impact of your decisions—without any real‑world consequences.
Connect with our experts
From shaping an AI vision to scaling solutions in production, we work with you as one team to drive AI transformation that truly brings impact.
Contact us